Thank Goodness for Broadband
- Jul 27, 2020
- 1 min read
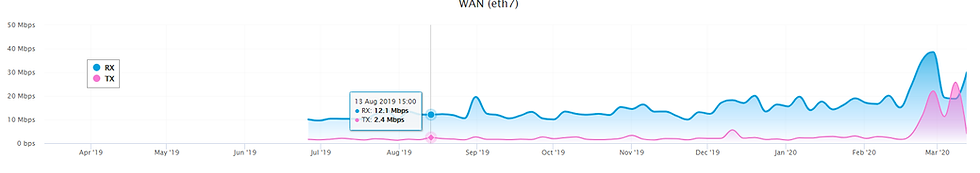
We have been reviewing the traffic on our network to ensure we have sufficient capacity going forward. As you can see from the charts below, on average we are barely reaching 20% of capacity. So rest assured, even during these exceptional times with the current levels of home working/schooling, RRCN has it covered!
The TX channel is traffic from the resident towards the internet
The RX channel is traffic from the internet to the resident
Ordinarily the TX traffic is much lower than the RX.
There are numerous explanations of where the TX is shown at similar levels as the RX, e.g.
A subscriber is hosting a website or streaming capability
A subscriber may be moving data between locations/backup etc
The other two main observations to take away are:
the peak utilisation (occasional peaks at between 20-40% of our current capacity, depending on which chart you view)
and
the average utilisation of use over time, on average 10-20% capacity)
Annual Use
Last Quarter

Last Month


Comments